Desktop app
Interface overview
Learn the AgentKit Desktop window layout, the sidebar groups, and how to read the Dashboard before you manage anything.
After this page you will recognize the main regions of the Desktop window, know which sidebar group holds each surface, and understand what the Dashboard numbers do and do not mean.
Screenshot provenance: the images on this page were captured from Desktop
2.5.0-beta.32 on 2026-08-01. This page describes the current Beta docs
contract independently of those images. They have not been recaptured or
visually verified against the current Desktop build, so labels and layout may
differ.
Read the window layout
The window has three fixed regions: a left sidebar for navigation, a top bar for the current location and filters, and the main panel for the selected surface. A status row at the bottom of the sidebar shows the App and CLI versions and the local sync indicator. On a wide enough window, a collapsible Assistant rail sits on the right edge for bring-your-own-key chat about your local usage.
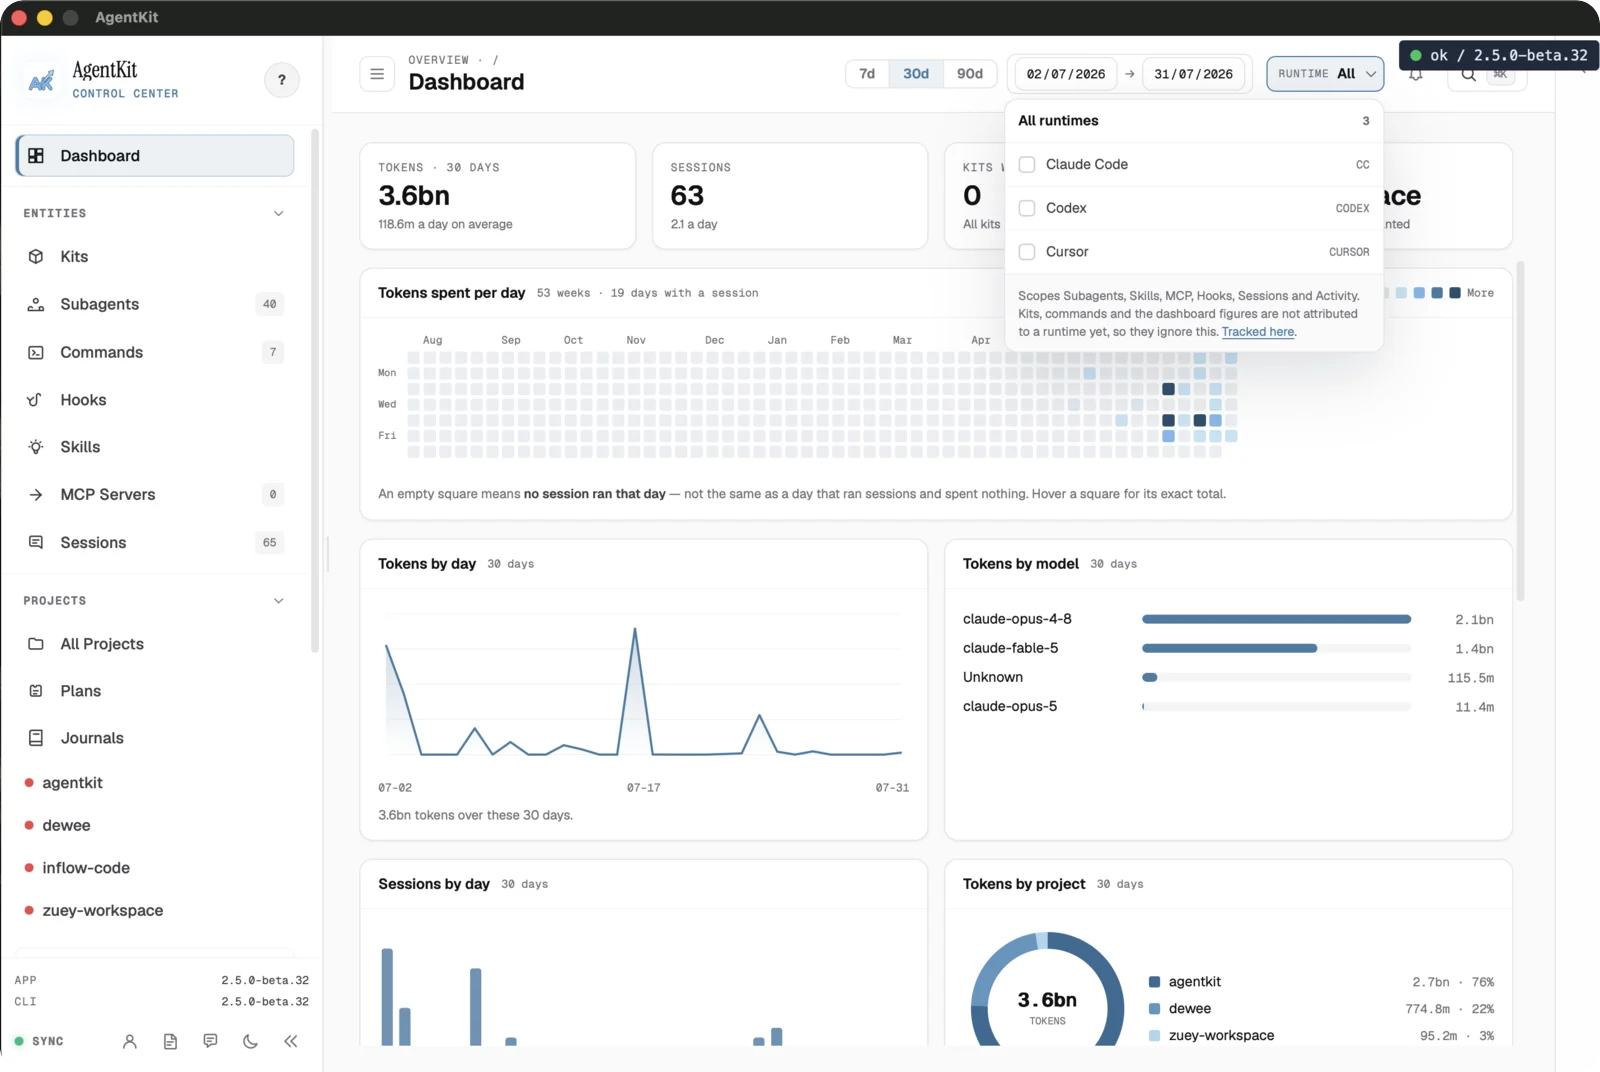
The sidebar groups surfaces by purpose:
| Group | Surfaces | What it covers |
|---|---|---|
| Entities | Kits, Subagents, Commands, Hooks, Skills, MCP Servers, Sessions | The installed AgentKit building blocks and recorded session evidence |
| Projects | All Projects, Plans, Journals, and your registered projects | Per-project state, plan tracking, and journals |
| System | Activity, License, Devices, Secrets, Security, Feedback, Settings, Status Line, Migrate | Local diagnostics, the secrets vault, app configuration, and maintenance workflows |
The top bar shows the breadcrumb for the current surface, a runtime filter, and search. Selecting a registered project in the sidebar opens its project dashboard rather than a global view.
The bell in the top bar opens Notifications. It flags an available AgentKit
update, a project whose files drifted from its kit manifest, and failed runs or
writes among the 50 newest Activity events; a red badge counts unread items.
Selecting an item marks it read and opens Settings, Projects, or Activity, where
you can resolve it. Dismiss hides it. Read and dismissed state is stored
under AGENTKIT_HOME, so Desktop and the browser dashboard share it. With
nothing to act on, the panel shows Nothing to flag.
Secrets appears only in the Desktop app, not in the browser dashboard. A few other pages carry details worth knowing about:
- Profile shows a Builder card with aggregate figures (Sessions, Tokens, Skill runs, Active days, top skills, and top agents) and an activity grid. Download PNG saves it as an image and Copy image copies it.
- Feedback lists the reports you filed from this machine under Your reports; see Settings and system.
- Activity has Events and Stats views. Events lists skill runs
and writes, including
write.completedandwrite.failedevents from kit installs and updates, migrations, config writes, hook toggles, and MCP links; filter by event kind. Below it, Snapshots lists the runtime-home snapshots taken before some writes, such as kit installs, updates, and uninstalls, migrations,ak new, and session redaction. Each row shows its time, file count, and size. Restoring stays a CLI action because it overwrites anything changed since the snapshot, so Copy restore command copies the exact command for you to review and run. A snapshot with no CLI restore path shows where its captured data is stored instead. Config writes and MCP links keep their own single-file backup and are not listed. - A session's detail shows its Git branch, Working directory, and
Worktree, or
not recordedwhen the session file does not say. Its Applied kits list shows the Kits installed now, not the set that was active when the session started, because a session file does not record it.
Understand the Dashboard figures
The Dashboard summarizes local usage: tokens over the selected window, sessions
per day, the per-day activity heatmap, session-length buckets, and breakdowns by
day, model, and project. Use the 7d / 30d / 90d control and the date range
to change the window.
The Session length card is served from the same analytics index as the other Dashboard cards. AgentKit buckets one indexed duration per session when it reads the selected window, so the card no longer runs a separate, project-capped transcript scan. A session without a positive measured duration is not placed in a duration bucket.
The Usage limits card lists rows per provider (claude, codex, cursor,
grok) and window (5h, week, and monthly for Cursor), each row carrying
a provenance badge and a quota bar, and refreshes every 60 seconds. Without
advanced polling, rows carry raw_only provenance — local token counts only,
no fabricated quota percentage. Claude Code and Codex rows add an approximate
equivalent API cost; Cursor and Grok keep no local transcripts, so their rows
show a dash for tokens and fill in only from advanced polling. The card stays
empty until the local index has counted usage. Desktop sets the index up on its
own unless you switched it off in the Database tab of Settings and
system, which also covers advanced polling and the
header badge and popover that read the same data.
These figures come from the local analytics index, not a billing source. They reconcile supported Claude Code and Codex session evidence while the window is open, so treat them as a local usage view rather than an invoice.
Filter by runtime
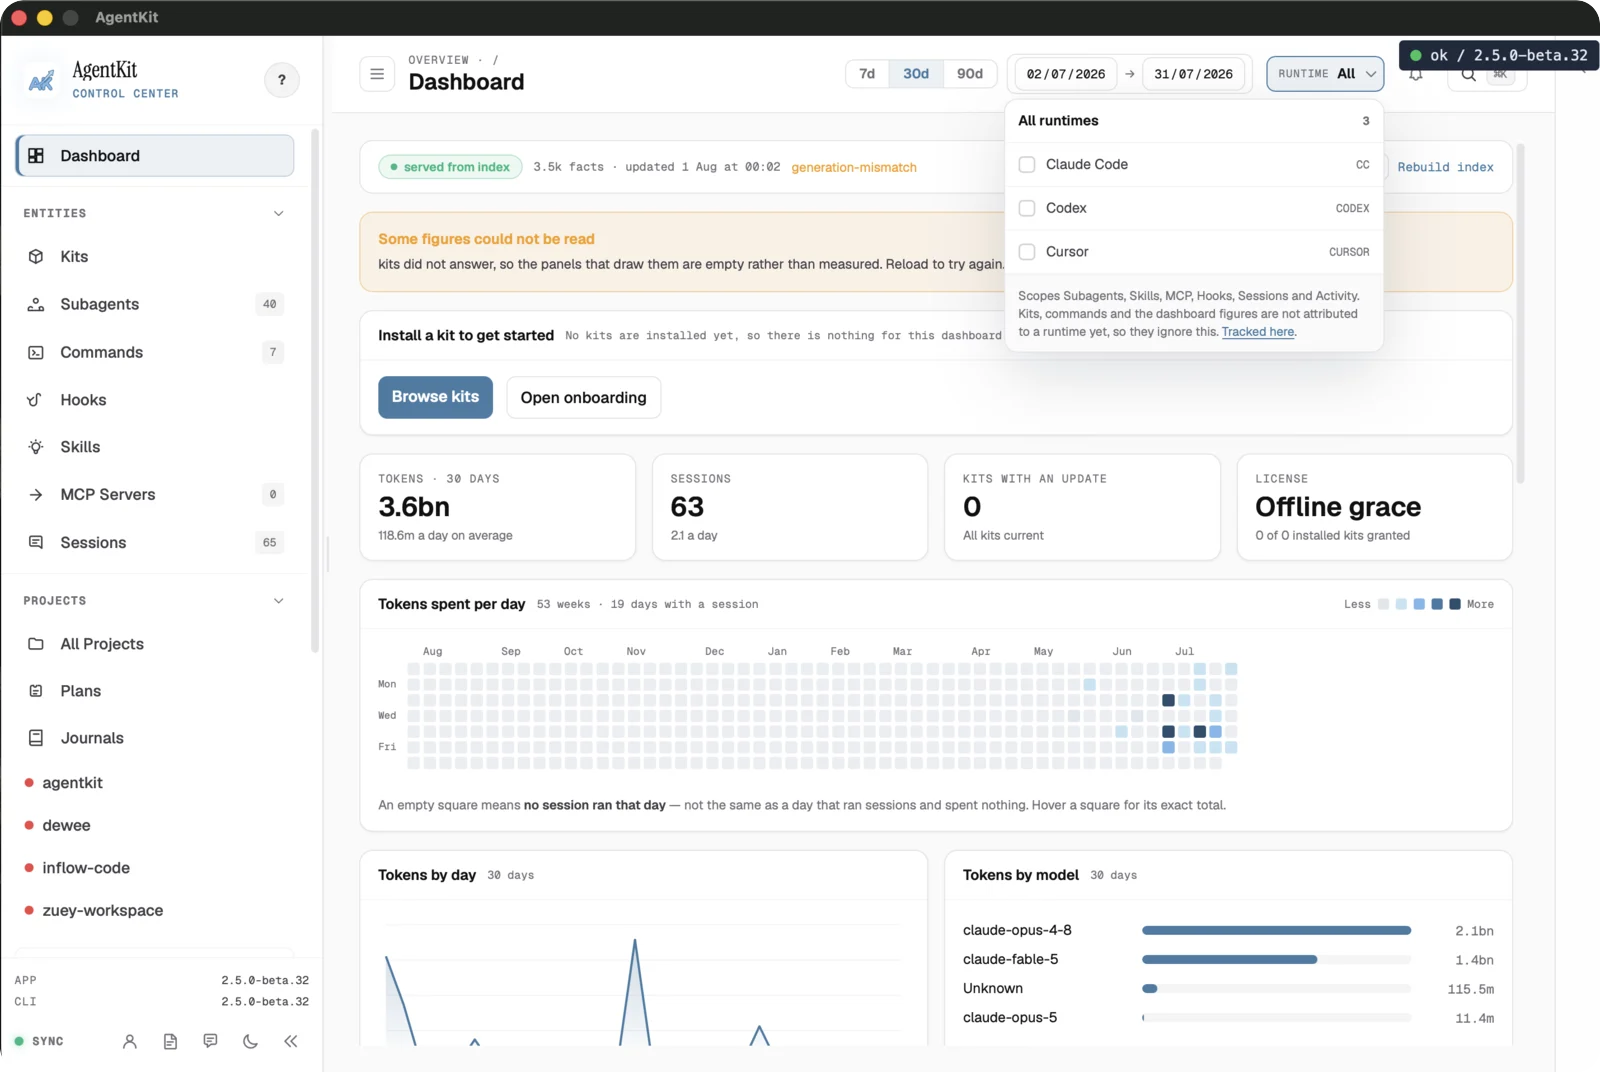
The runtime filter scopes Subagents, Skills, MCP, Hooks, Sessions, and Activity
to one coding agent. Kits, commands, and the Dashboard figures are not attributed
to a runtime, so they ignore this filter. A served from index note with a
generation-mismatch badge means the index is behind the current state. Desktop
brings it up to date on its own; to refresh it now, use Sync now in the
Database tab of Settings.
Recognize the empty state
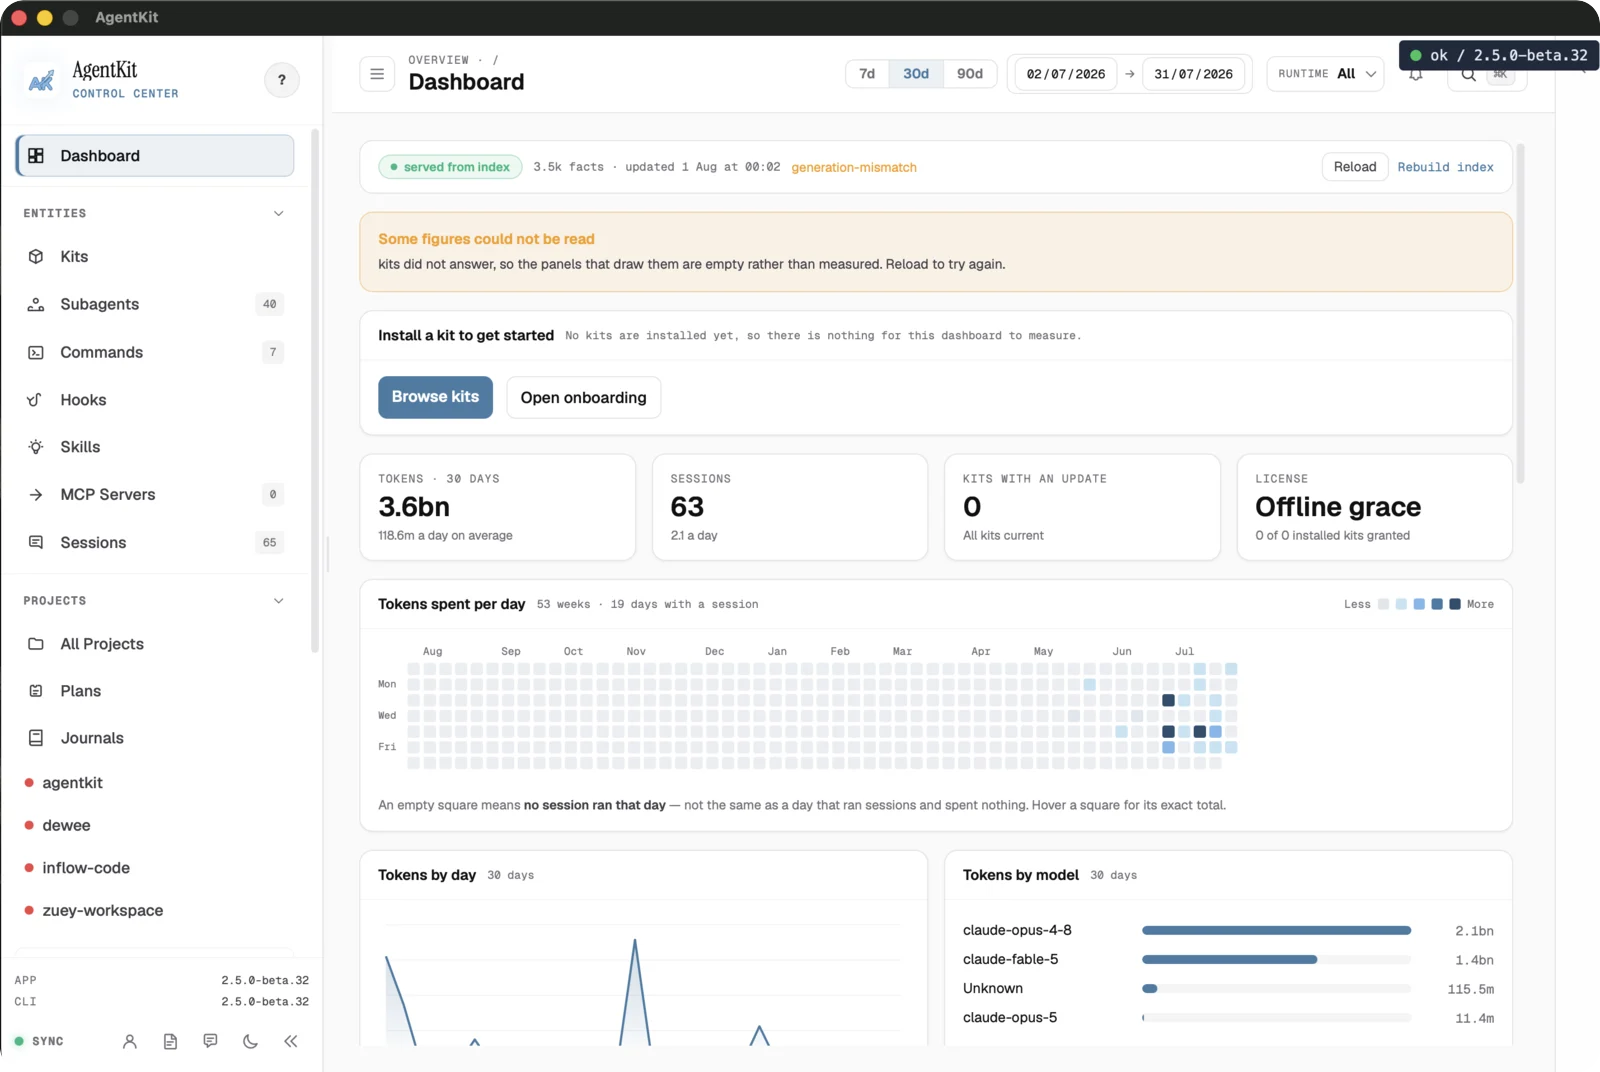
Before any Kit is installed or indexed, the Dashboard shows an empty state with
Install a kit to get started and zeroed metrics. A Some figures could not be read banner means a panel could not draw from the index; reload to try again.
Neither state is an error — it reflects local setup that has not produced data
yet.
Next, learn how to work with the installed building blocks in Managing entities.